Blue Matador App
Infrastructure monitoring application lead UXUI and visual designer.
Blue Matador is the easiest way to monitor your AWS environment. Just provide your read-only credentials and start getting insights in minutes. With Blue Matador’s machine-learning algorithms, instantly have a pulse on the health of your AWS infrastructure.
User requests and feedback
Getting to know our customers and solve their monitoring needs.
We have open Slack channels with the engineering teams of our customers for feedback and feature requests. By keeping in contact with our users we were able to add features and test our product faster.

Sprint Planning
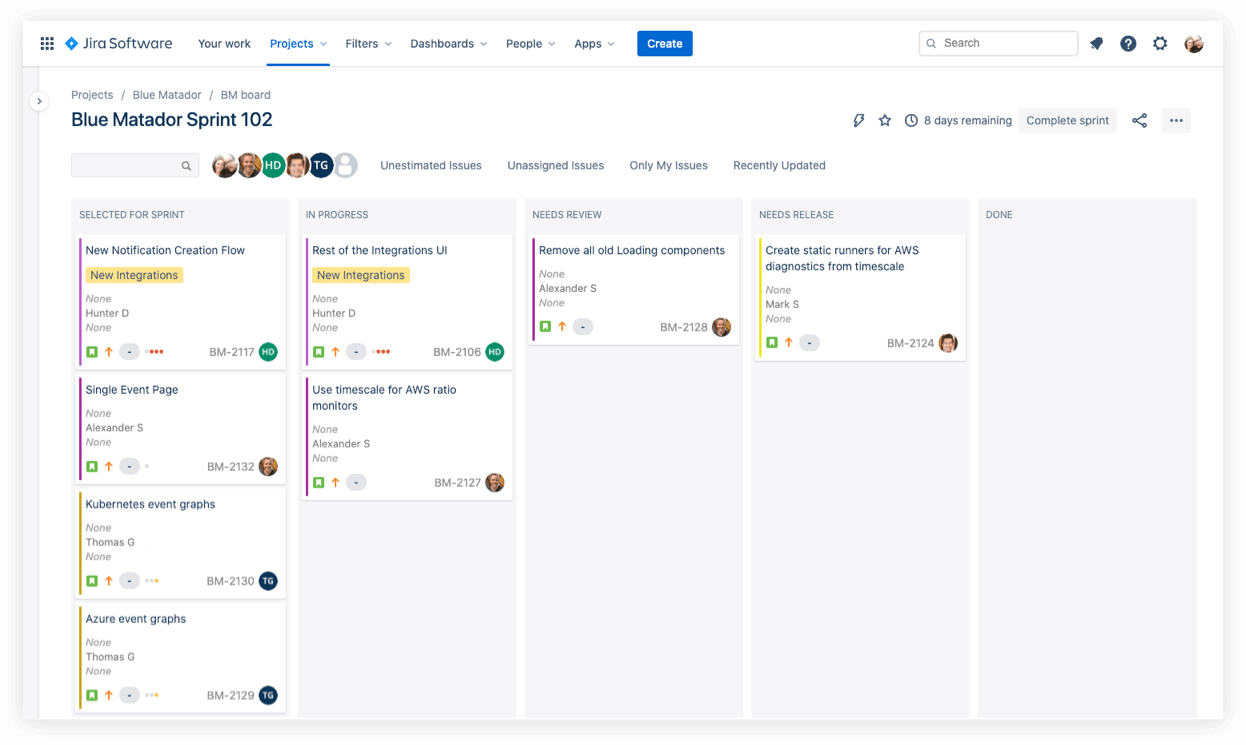
Planning, estimating time and tracking the project in Jira.
Each week we would plan different parts of the app as a team to keep the project on track. Working with the dev team I was able to see planning from a new perspective and learn how to design within the strengths of our developers by working together from the start.
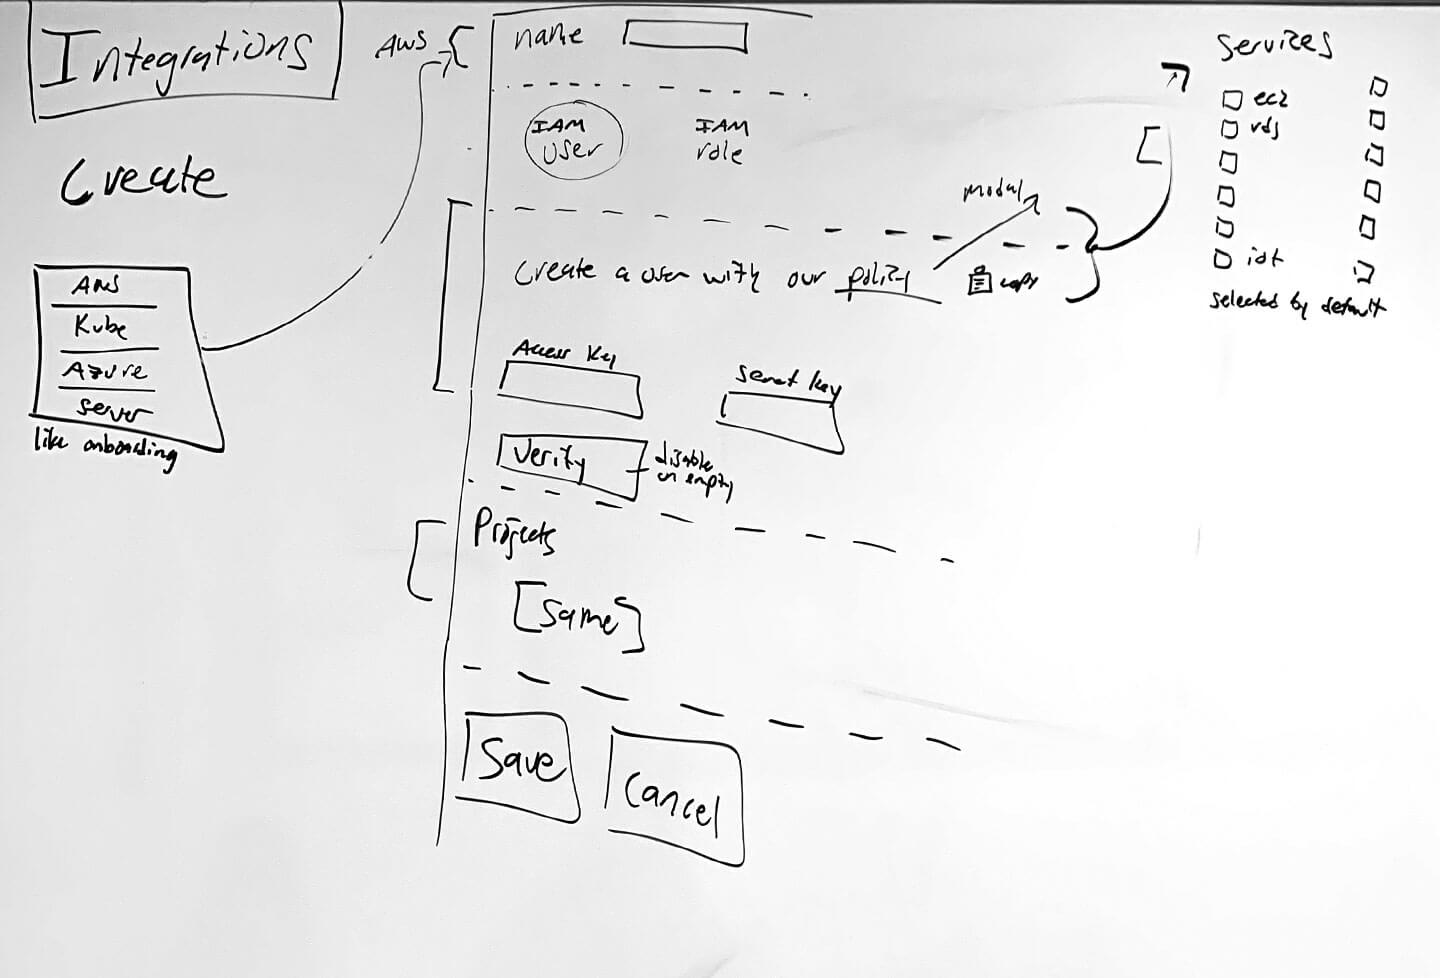
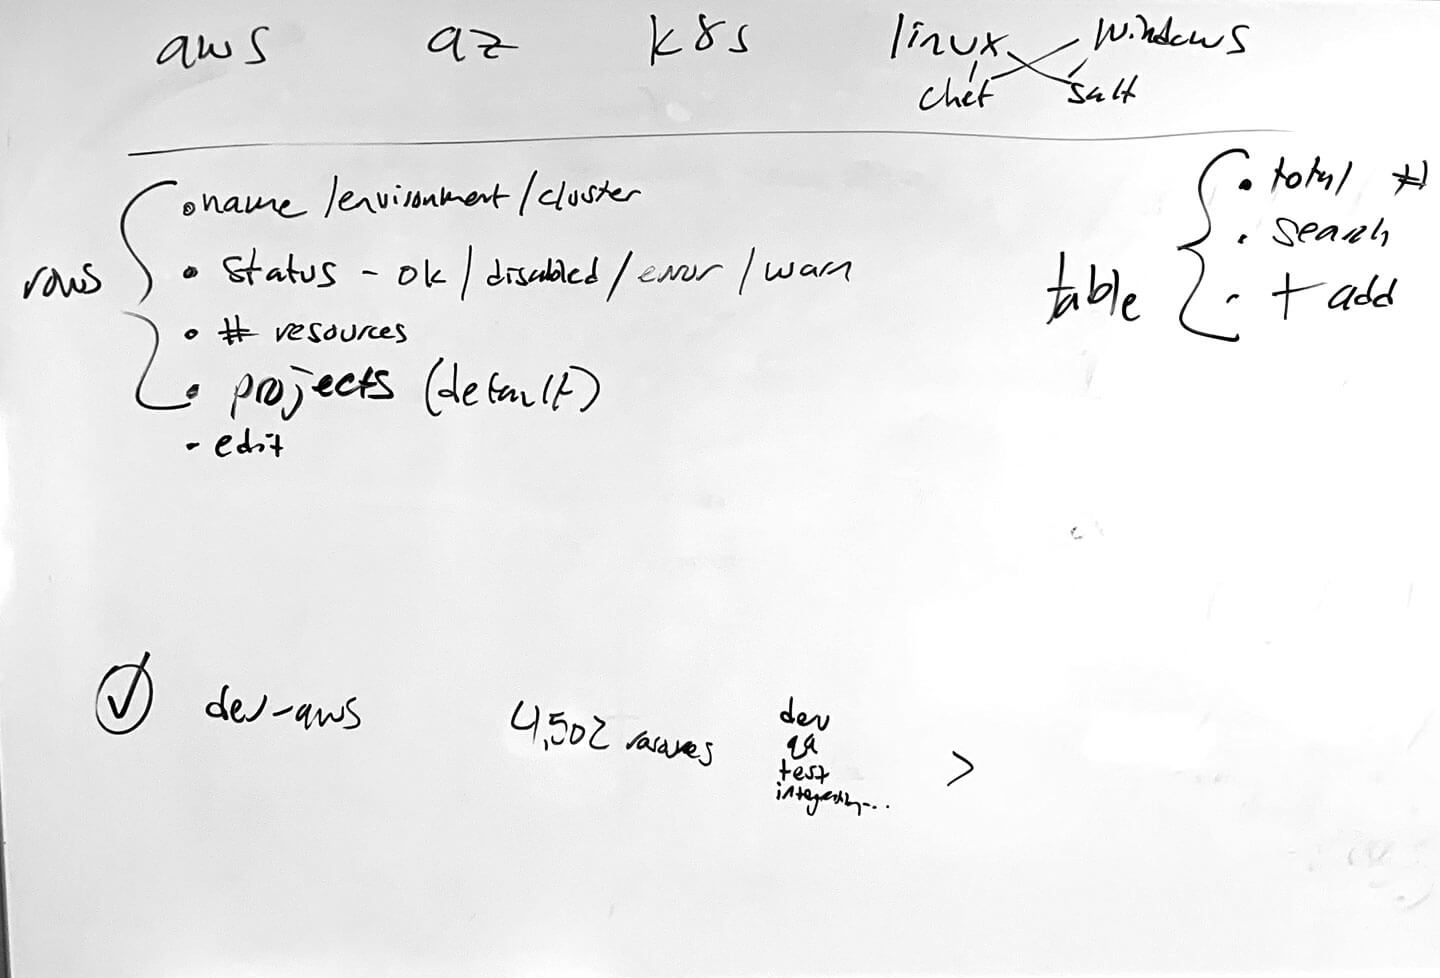
WHITEBOARD
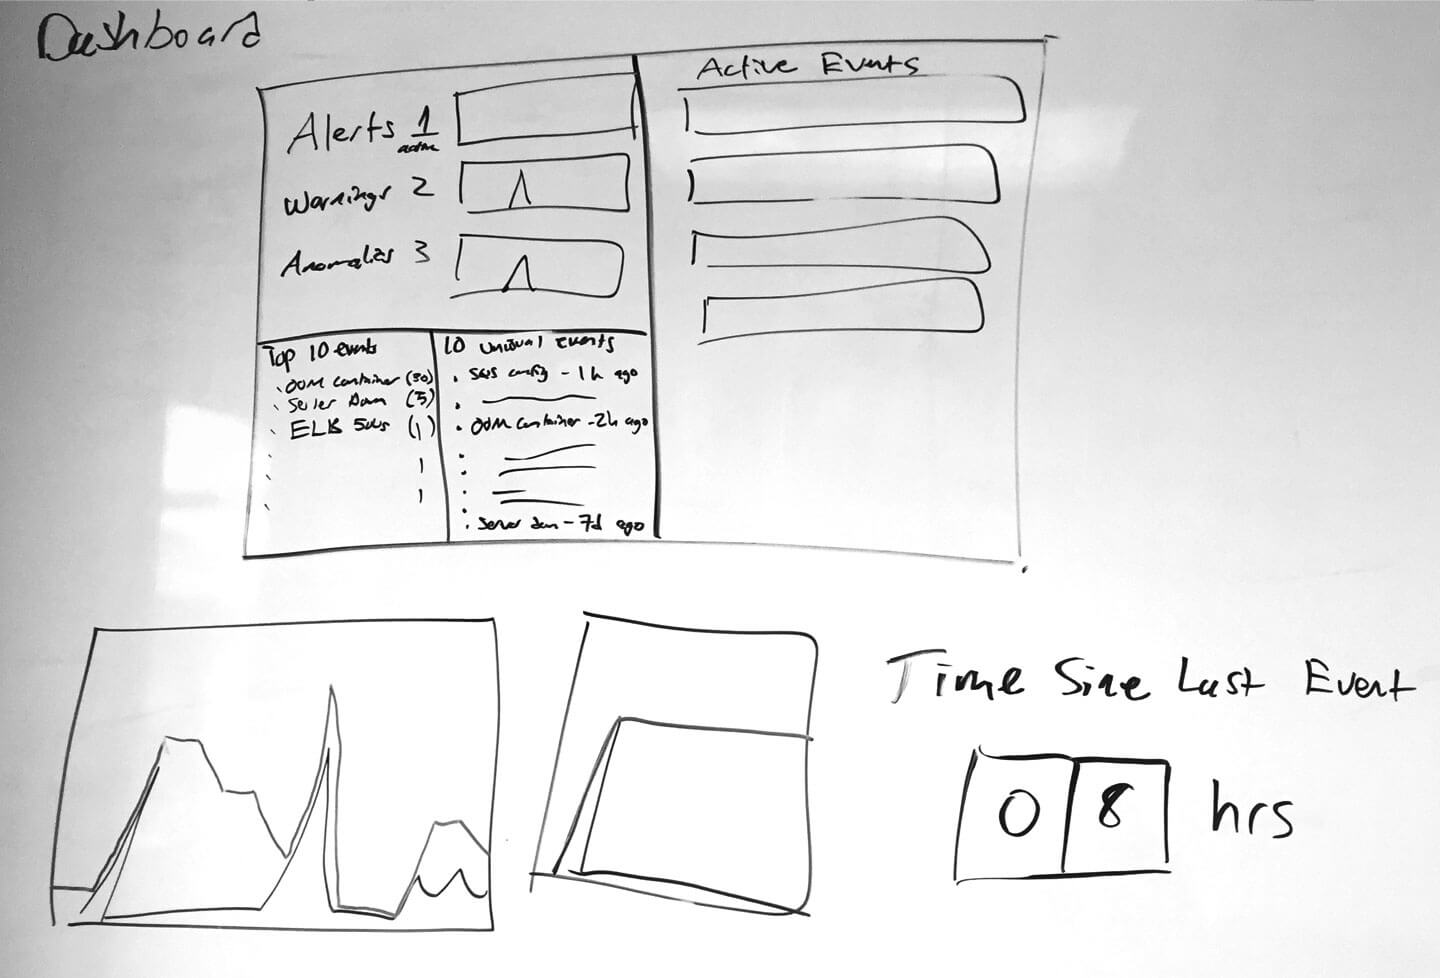
Planning each section of the app for the right product-market fit.
Working with a dedicated DevOps engineer we planned each section of our app together, ensuring the designs would be useful for our customers. We didn’t just design the app to look good, we helped solve our users’ problems by showing them issues before they happened.
Product Design
Multiple sections all working together.
Each section of the app is designed for a different purpose and customer need.
THE DASHBOARD
The centerpiece of the app.
The Dashboard is where you will see a real-time view of the events in your system. The dashboard is meant to provide at-a-glance information on the health of your system and looks great on a TV in your office.
Features include:
- Active Events
- Event Stream
- Frequent/Infrequent Events
- Projects
- Dashboard User
Managed Monitors
Get insights without the digging out of the box.
Typical monitoring tools require you to dig through endless graphs. We designed Blue Matador to provide proactive insights front and center with no effort from you. It triages events based on actionability and automatically notifies you without any manual alert configuration. Use fine-tuned defaults and customize if needed.
ATLAS
Monitoring at a glance.
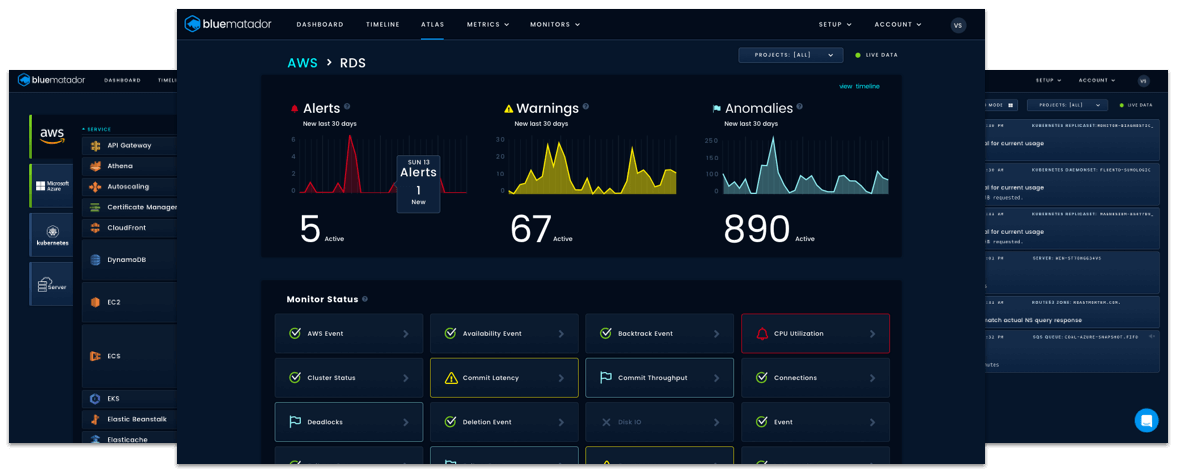
We designed Atlas so users can browse the page to see everything Blue Matador is monitoring at a glance. Users can navigate through each resource for more detailed insights to better understand the issues we alert on.
Metrics Explorer
Search and view metrics effortlessly.
View, filter, and group metrics in the Metrics Explorer via a simple search, and then save searches to create dashboards instantly. For Dev-focused teams with minimal dedicated Ops, Blue Matador is like another member of your team that doesn’t sleep – so you can be secure that you won’t miss anything.
Timeline
View past and current events.
Alerts, Warnings, and Anomalies are all displayed with summary information. Selecting an event will open up the details pane with full details.
Features include:
- Event Graph
- Time Selection
- Live Update
- Event List
- Event Details
- Filtering
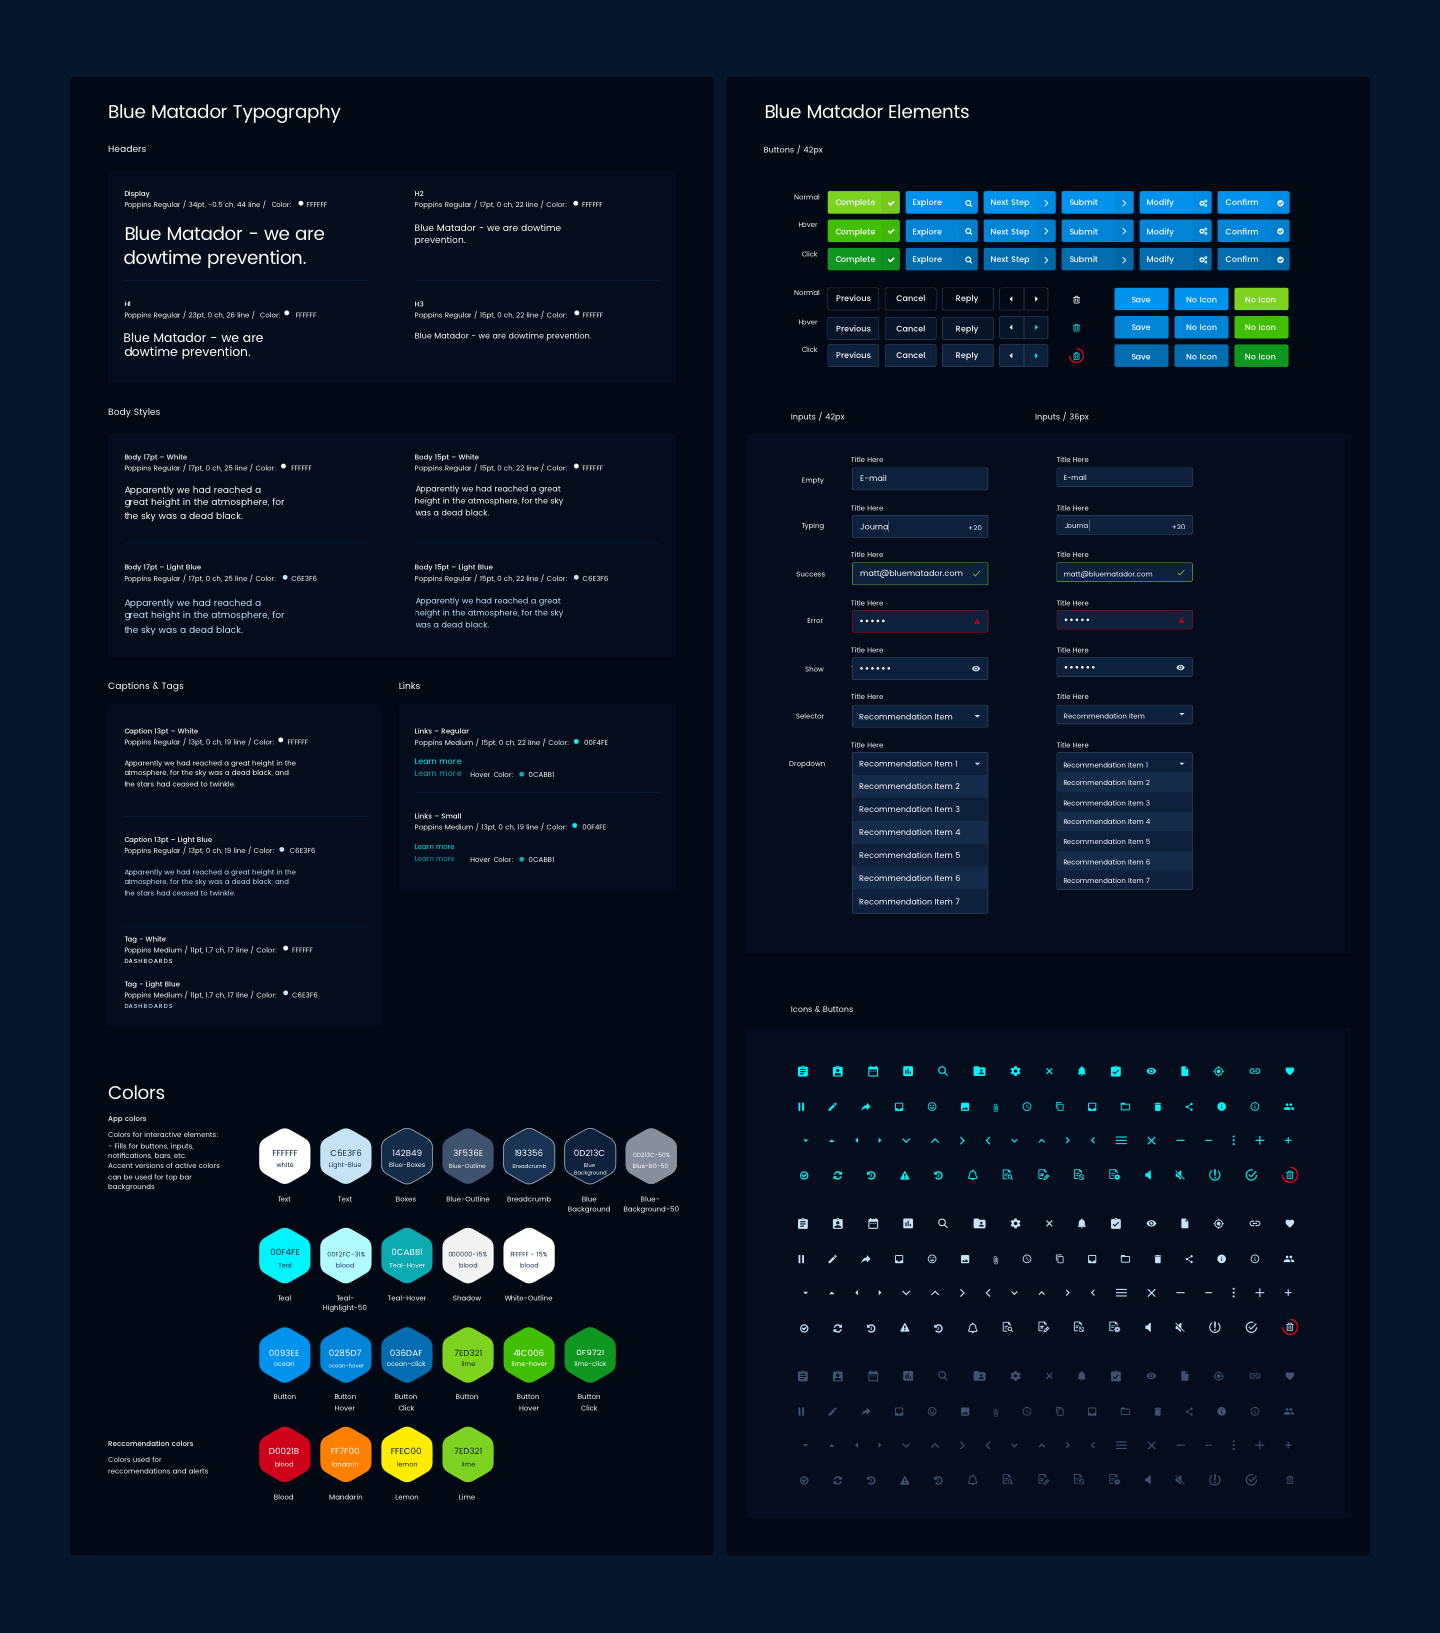
Style Guide
We established styles early in the design.
By establishing styles early we were able to design, build, and release new features faster than starting from scratch. I worked with the engineering team to update design files to match actual builds and reuse styles for new features.
Outcome
Challenge, solution, and results.
Listen to customers, design, and develop a tool that will help their business grow. Here are a few case studies from some of our clients, and how we helped them.
Business Challenge 1
Maintain high uptime and performance while reducing the needed investment in DevOps headcount and tooling.
Solution
Blue Matador automatically and proactively provides all AWS alerts, enabling the RentDynamics team to increase uptime while maintaining their lean investment in DevOps
Results
- Moved from reactively addressing issues raised by customers, to proactively resolving potential issues before customers are affected
- Maintained lean investment in DevOps, enabling continued focus on feature development
- Reduced mean time to resolution by correlating alerts to identify
Business Challenge 2
Setting up actionable alerts and notifications after migrating from on-prem to AWS with limited … AWS knowledge and limited time to sink into setting up alerts with a traditional monitoring tool.
Solution
Out-of-the-box, Blue Matador provided instance monitoring and alerting coverage for Shopper Approved’s AWS environment without any configuration.
Results
-
Moved from reactively addressing issues raised by customers to proactively addressing them before customers were affected
-
Avoiding the wasted time of setting up and configuring alerts and notifications with a typical monitoring tool
-
Confidence to easily troubleshoot potential issues even with new, unfamiliar AWS services
-
Peace of mind knowing Blue Matador will automatically set up alerts and notifications as AWS use is expanding into new services
Business Challenge 3
Infrequent code deployments to production and slow development cycles due to lack of insight and knowledge of system issues.
Solution
Without the toil of setting up alerting and notifications typical with a traditional monitoring tool, Blue Matador provided full monitoring coverage of all AWS resources, allowing the team to deploy code daily.
Results
-
Drastic increase in speed to market by moving from deploying code monthly to deploying code to production many times a day
-
Ability to identify issues in the development environment before it ever reaches production environment
-
Time saved by avoiding manually setting up alerts and notifications with a typical monitoring tool
-
Greater confidence in the health of the system due to the ability to check health status at a glance
